
Abstract: Probability distributions are widely used across various fields such as insurance, physics, engineering, computer science, and even in social sciences like psychology and medicine. They are not only easy to apply but also have a broad range of real-world applications. This article explores six key probability distributions that are commonly encountered in daily life, providing detailed explanations and practical examples of their use.
01 Introduction
Imagine you're a university professor who has just graded all your students' assignments for the week. You pass the scored papers to the data entry team, asking them to create a spreadsheet with all the student grades. However, they only store the scores without associating them with the respective students. In addition, they accidentally skip some entries due to a rush, and now you don't know which grades are missing. How would you go about solving this problem?
One approach is to visualize the data to identify any patterns or anomalies. By plotting the frequency distribution of the grades, you might notice a dip in the graph, indicating that certain scores are missing. This could be a sign that the data is incomplete, and you can use statistical methods to estimate the missing values or detect inconsistencies.
This scenario highlights how data analysis can be used to solve real-life problems. For anyone working in data science, statistics, or related fields, understanding probability distributions is essential. These distributions help us interpret data, make predictions, and draw meaningful conclusions from random events.
While probability provides the mathematical framework for understanding randomness, distributions allow us to see the underlying structure of the data. In this article, I will introduce and explain several important probability distributions, covering both discrete and continuous types, and show how they apply in real-world situations.
Note: This article assumes that you have a basic understanding of probability theory. If not, I recommend reviewing foundational concepts before diving into the distributions discussed here.
02 Common Data Types
Before we dive into specific distributions, it's important to understand the two main types of data: discrete and continuous.
Discrete data consists of distinct, separate values. For example, when rolling a die, the possible outcomes are 1 through 6—no other numbers are possible. Similarly, the number of people in a room is always an integer.
Continuous data, on the other hand, can take on any value within a given range. For instance, a person's height or weight can vary continuously, with infinite possibilities between any two measurements. The same applies to time, temperature, or distance.
Understanding the difference between these two types of data is crucial when choosing the right probability distribution for a given situation.
03 Types of Distributions
Bernoulli Distribution
The Bernoulli distribution is the simplest form of a probability distribution. It models experiments with only two possible outcomes: success (1) and failure (0). The probability of success is denoted by p, while the probability of failure is q = 1 - p.
The probability mass function for a Bernoulli random variable X is given by:
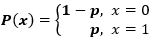
For example, if the probability of rain is 0.15, then the probability of no rain is 0.85. The expected value of a Bernoulli distribution is E(X) = p, and the variance is Var(X) = p(1-p).
Uniform Distribution
A uniform distribution occurs when all outcomes in a range are equally likely. For example, if a florist sells between 10 and 40 bouquets per day, the probability of selling any number in that range is the same.
The probability density function for a uniform distribution is:

The mean of a uniform distribution is (a + b)/2, and the variance is (b - a)^2 / 12.
Binomial Distribution
The binomial distribution models the number of successes in a fixed number of independent trials, each with the same probability of success. For example, flipping a coin multiple times and counting the number of heads follows a binomial distribution.
The probability mass function is given by:
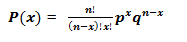
The mean is np, and the variance is np(1 - p).
Normal Distribution
The normal distribution, also known as the Gaussian distribution, is one of the most widely used distributions in statistics. It is symmetric around the mean and describes many natural phenomena, such as human height, test scores, and measurement errors.
The probability density function is:
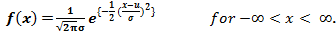
The standard normal distribution has a mean of 0 and a standard deviation of 1.
Poisson Distribution
The Poisson distribution models the number of events occurring in a fixed interval of time or space. It is often used for rare events, such as the number of calls received by a call center in an hour or the number of typos in a book.
The probability mass function is:
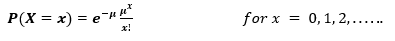
The mean and variance of a Poisson distribution are both equal to λ.
Exponential Distribution
The exponential distribution models the time between events in a Poisson process. It is often used in survival analysis, such as predicting the lifespan of a machine or the time until a customer arrives at a service desk.
The probability density function is:
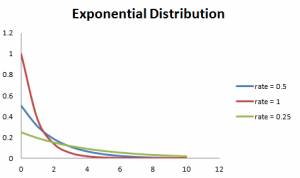
The mean is 1/λ, and the variance is (1/λ)^2.
04 Relationship Between Distributions
The Bernoulli distribution is a special case of the binomial distribution when there is only one trial. The Poisson distribution can be seen as a limiting case of the binomial distribution under certain conditions. The normal distribution can also be derived as a limit of the binomial distribution, and it is closely related to the Poisson distribution as well.
Additionally, the exponential distribution is closely related to the Poisson distribution. If the time between events follows an exponential distribution, the number of events in a given time period follows a Poisson distribution.
05 Conclusion
Probability distributions are fundamental tools in statistics and are used in a wide variety of applications, from finance and engineering to biology and social sciences. Understanding these distributions helps us model real-world phenomena, make predictions, and analyze data more effectively.
In this article, we explored six key distributions—Bernoulli, uniform, binomial, normal, Poisson, and exponential—and explained their properties, applications, and relationships. With this knowledge, you should now be able to recognize, compare, and apply these distributions in different contexts.
Electric Power Components,Multi-Function Power Instrument,Cckem6 Three-Phase Multi-Function,Three Phase Power Monitoring
ZHONG HAN INTERNATIONAL TRADE CO., LTD , https://www.cck-ht.com